How to debug Xamarin in Visual Studio 2017
18 Mar 2018 1 minute read editAnyone who has worked with Xamarin is well-aware that the platform is still in its infancy. It’s an interesting framework, but it is riddled with bugs, performance issues and visual studio doesn’t always play ball.

Version 15.6 and 15.6.1 did completely break my solution, but 15.6.2 seems to have resolved the issue!
Anyway, despite the bugs and performance issues, by far the most frustating part of Xamarin was debugging. When debugging using the emulator or a physical device, stepping through the code would occasionally frequently cause the device to just crash and burn with the white screen of death. This effectively means that to try and find the problem code, I would have to perform a binary breakpoint search, where I would narrow down the amount of code that runs until I find the line that cause the exception, which killed the debugger. In other words, run and hope!
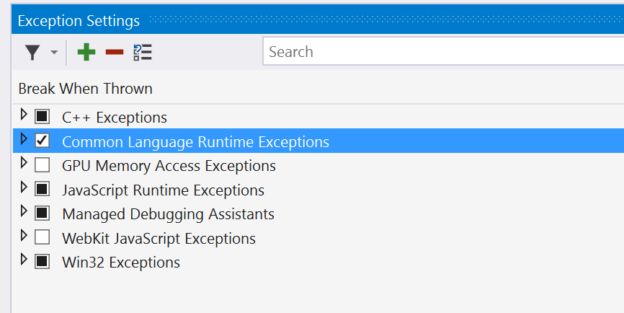
One morning, out of pure frustration I did a bit of researching into the topic, why Xamarin exceptions weren’t handled in the debugger. Research, revealed that Visual Studio, only catches a subset of exceptions excluding a number of Java and related exceptions. Further reading, I discovered that visual studio has an option to cherry pick the exceptions!
Debug > Exception Settings
