NDepend - Static Code Analysis
26 Jul 2018 22 minute read editOver the past few months, I have been trialling a number of different tools to help me improve code quality. However, static code analysis it’s something that I was yet to use… until now!
Introduction
As a quick recap, over the past few months I’ve tried a number of popular ‘code quality’ tools such as ReSharper, but the only ones which I’ve embedded into my daily work are Roslynator and IntelliCode; both of which are excellent. I was really excited to try NDepend, particularly as it’s a tool that is recommended by many leading .NET developers (including Scott Hanselman and Steve Smith) and so I went into this review with high expectations. For the record, the author of NDepend, Patrick Smacchia, was generous enough to give me a license so I could write up this post. Let’s dive in!
What is it?
I purposely went into this with very little prior knowledge, as I wanted to gauge how easy it was for someone with no experience to use. First things first, I searched for a quick description on what NDepend offers:
NDepend is a static analysis tool for .NET managed code. The tool supports a large number of code metrics, allowing to visualize dependencies using directed graphs and dependency matrix. The tool also performs code base snapshots comparisons, and validation of architectural and quality rules. User-defined rules can be written using LINQ queries. This feature is named CQLinq. The tool also comes with a large number of predefined CQLinq code rules. Code rules can be checked automatically in Visual Studio or during continuous integration.
Let’s use it
I decided to throw both myself and NDepend straight into the deep end. I’ve recently reconfigured my media management to make use of Docker, so I decided to run it against one of the services that I’ve been using: Sonarr. I will be using NDepend with Visual Studio 2017 Community Edition.

Once it had finished analysing the project, I was greeted with a high-level overview of the code quality for the given project:
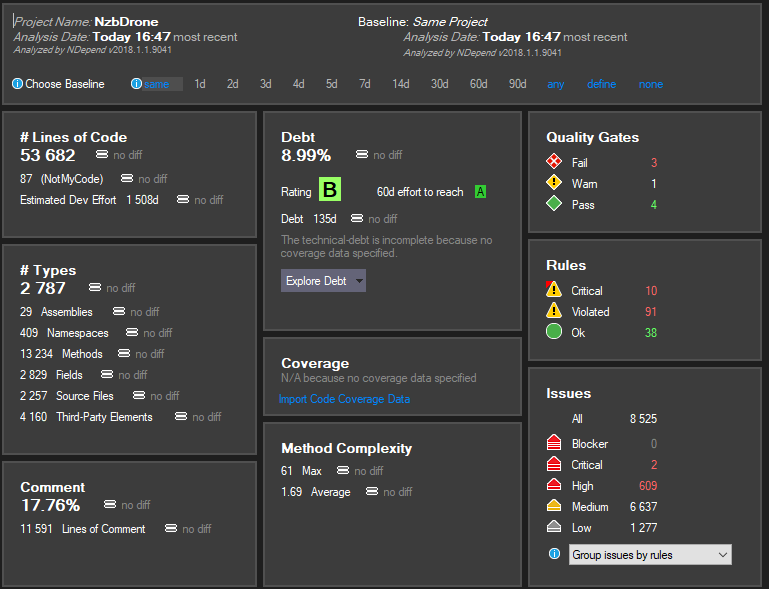
I was actually quite tactical about picking Sonarr as my first run, as a more experienced colleague of mine had always rated their code quality.
Seeing this high-level summary window for the first time, I quickly started thinking about what these values meant and concluded that even as a beginner, most are rather intuitive. Despite having not looked at the source code, this window gave me a valuable insight into the overall code base.
At this point, I decided to start looking at the documentation to see what each of these values meant. There are dozens of metrics to gauge the code base quality but for this review, I will look at the Rules, Debt, Diagrams, and Reporting.
Rules: “a massive high five from me”
From the NDepend analysis dashboard, I decided to take a look at what rules were being violated and why:
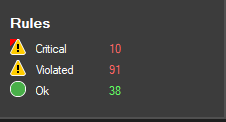
So, I clicked on the ’10’. This causes the UI to update with a new window:
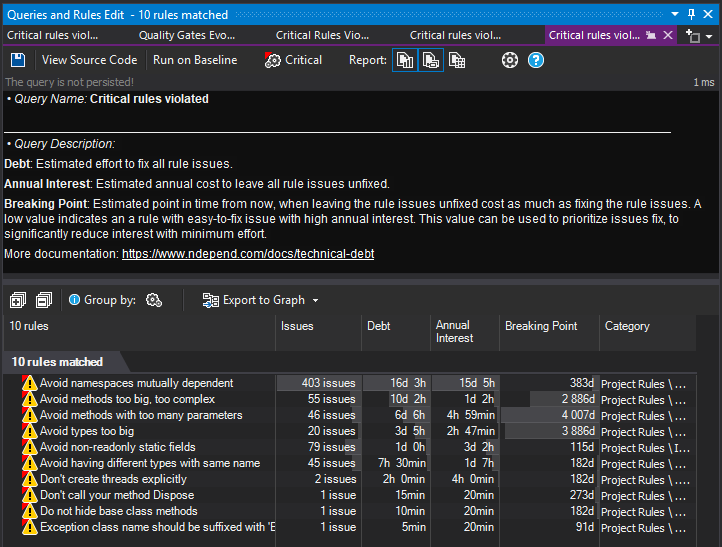
How cool is that? Not only does it clearly highlight the rules, but it also provides you with some metrics on the cost of not fixing the issues. Having metrics like these are even more valuable than one might think. I have learned from experience that since technical debt is intangible to stakeholders, it is far too easy to postpone and never truly address. I’m sure as developers we can all relate to situations where technical debt is put on the backburner and new features always come first. There will always be scenarios where releasing a feature is more important than fixing the debt, but as developers, it’s critical that we do not lose track of it entirely. Choosing not to address technical debt is never a good idea, but even worse is when developers are unaware of the debt in the code base altogether. This is why I love these metrics – it makes the intangible tangible, forcing teams to acknowledge and tackle debt much sooner.
Another thing that I like about NDepend is that each section seems to have a mini little tutorial or description to explain the meaning of a value. Generally, I found most definitions to be clear and concise. However, the wording for the definition of “Breaking Point” (in the image above) was one of a few exceptions for which I struggled to quickly grasp the meaning. After a few read-throughs, I think I would have preferred a definition like below:
Breaking Point: When the cost of fixing the issue is less than or equal to the cost of not fixing the issue. Or more succinctly: Cost to fix ≤ The cost of not fixing.
Now going back to the rules, even though I was not familiar with the code base I felt the ‘titles’ made it very clear on exactly what each rule was. I went for the simplest issue with the lowest breaking point, and, once more, I double clicked “Exception class name….suffixed with ‘Exception’”. Here is the UI with the class it identified:
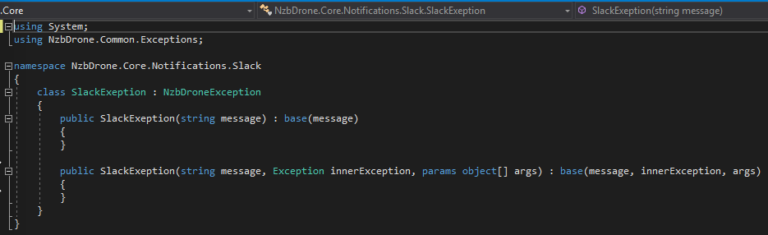
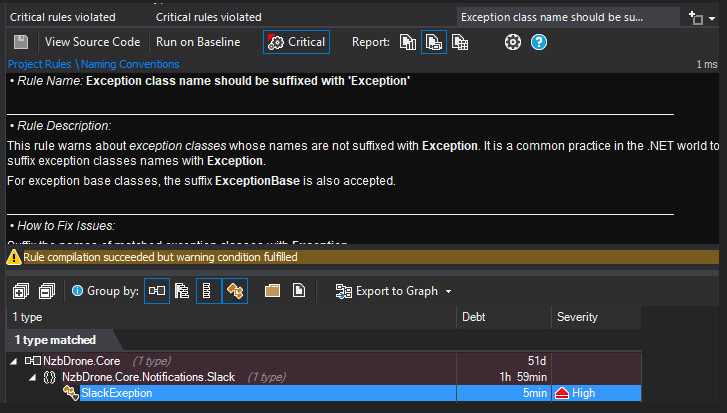
The UI made the drilling down very easy, but as soon as I saw the class on the left I thought the rule was wrong! However, if you haven’t already noticed, it’s actually named SlackExeption, not SlackException! This was really cool – I had already found an error (or typo) in the codebase. I had a look on their GitHub, and this class was actually added in June 2016!
I then went ahead and tried a few of the other rules, and one had been violated over 400 times! The UI that is used to represent this information is excellent. When you drill down, each part has a description explaining what the rules are and how to fix that rule. This made me wonder whether the rules could be configured… they sure can! By clicking on the ‘View Source Code’, you can actually see the query that populates and searches for that particular rule. Here is the code:
// <Name>Exception class name should be suffixed with 'Exception'</Name>
warnif count > 0 from t in Application.Types where
    t.IsExceptionClass &&

// We use SimpleName, because in case of generic Exception type
// SimpleName suppresses the generic suffix (like <T>).
!t.SimpleNameLike(@"Exception$") &&
!t.SimpleNameLike(@"ExceptionBase$") // Allow the second suffix Base
                                     // for base exception classes.
select new {
   t,
   Debt = 5.ToMinutes().ToDebt(),
   Severity = Severity.High
}

//<Description>
// This rule warns about *exception classes* whose names are not
// suffixed with **Exception**. It is a common practice in the .NET
// world to suffix exception classes names with **Exception**.
//
// For exception base classes, the suffix **ExceptionBase**
// is also accepted.
//</Description>
//<HowToFix>
// Suffix the names of matched exception classes with **Exception**.
//</HowToFix>
Even the list showing all the rules themselves can be configured:
// <Name>Critical rules violated</Name>
from r in Rules
where r.IsCritical && r.IsViolated()
orderby r.Debt().Value descending
select new {
   r,
   Issues = r.Issues(),
   Debt = r.Debt(),
   AnnualInterest = r.AnnualInterest(),
   BreakingPoint = r.BreakingPoint(),
   Category = r.Category
}
The very first time I looked at it I instantly thought it very LINQ-like, and a further google revealed that it is indeed a customized version of LINQ called CQLINQ. Having a custom query language based on LINQ gets a massive high five from me. I decided to try and modify the rule, and, in turn, it automatically detected my changes and instantly reapplied the rule. The real-time feedback is a great user experience!
Technical Debt: “needs a scale that is more abstract than time”
Now I decided to rewind and go back to the initial screen and look at another metric, this time technical debt. For those who aren’t too familiar with what that means, here is a brief definition:
Technical debt is a concept in software development that reflects the implied cost of additional rework caused by choosing an easy solution now instead of using a better approach that would take longer.
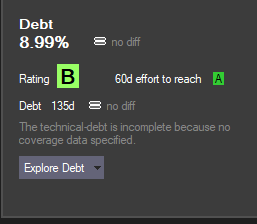
In Sonarr’s code base, the technical debt stands at a B, which for an open-source project of that size sounds like a good result:
As with the rules in the previous section, I decided to start drilling down. I clicked on the percentage which then took me to a new tab showing me the technical debt. As expected, the rule the code base violated from the previous section was included below:
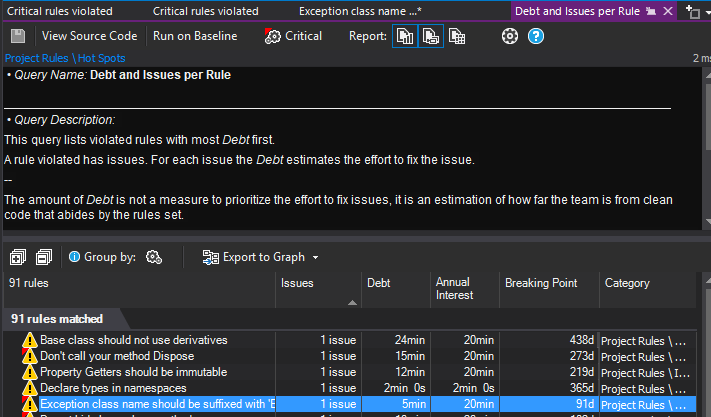
One of the things that I really like about this view is that you can sort and group by category, making it easier to uncover problem areas. I can see this being extremely helpful in a bigger team, where you can try and look out for the common issues. There are a bunch of groups, including things such as Naming conventions, Dead code, visibility etc.
Interestingly, NDepend seems to map most things to time. For instance, technical debt is represented as a figure of days (from the dashboard), which made me wonder how this value was derived and whether this value could be configured. After a few minutes, I found that time could be configured in an option. Furthermore, I also learned there are a large number of different options, which is great as it appears to allow a high degree of customization. It’s also great to see that NDepend provides a solid set of defaults, without any configuration necessary!
Here are the options for configuring man-time:
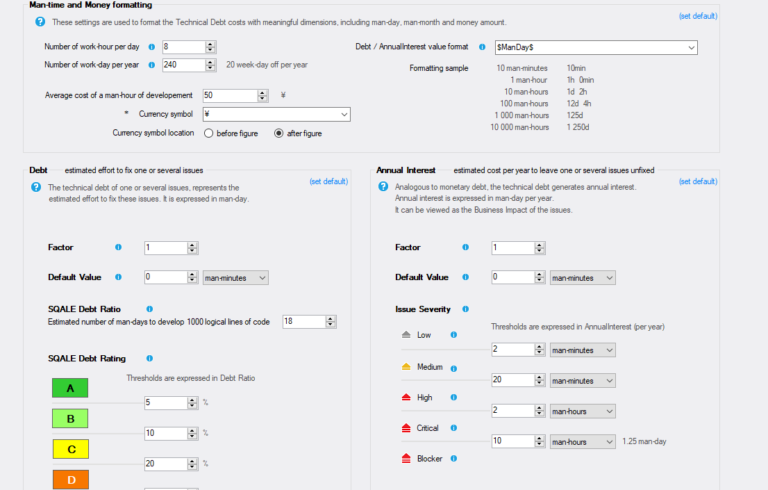
It’s all very self-explanatory, but I would have liked the option to use a completely different scale… perhaps a scale that is more abstract than time.
By this, I’m strictly referring to the agile methodology, where one might choose to use ‘story points’ rather than a man day. Time is, of course, far more tangible and concrete, but points solve a problem that time cannot: let’s say you have two developers working on a project. One is senior and the other is junior. The junior developer will likely take longer to complete a task than the senior developer. The company, of course, requires an estimated completion time, and so both developers must agree on the time in which it takes. The senior might say “2 hours”, and the junior might say “4 hours”. If we tried to average this out to “3 hours”, then it’s now an invalid estimate for both developers. Both estimates are perfectly correct, however the item cannot be estimated unless we know who will develop the task. It’s a known problem and one that cannot be solved with time.
However, by using an abstract concept of time – such as story points – both developers can agree that a task takes a certain number of points. Yes, the senior developer will complete more points in a day than the junior, (and as a consequence will have a higher velocity), but at least they can now both estimate on the same scale. I hope to see this as an area that NDepend will explore in the future, especially as it would integrate perfectly with teams practising Scrum.
Diagrams: “finding ways to visually represent complex information”
Sometimes you want an even higher-level overview of the code base. NDepend not only provides you with information to literally pinpoint the line of code that is the culprit, but it can also visually graph those metrics!
Below are some examples of diagrams that NDepend can support, each of which is fully customisable and interactive.
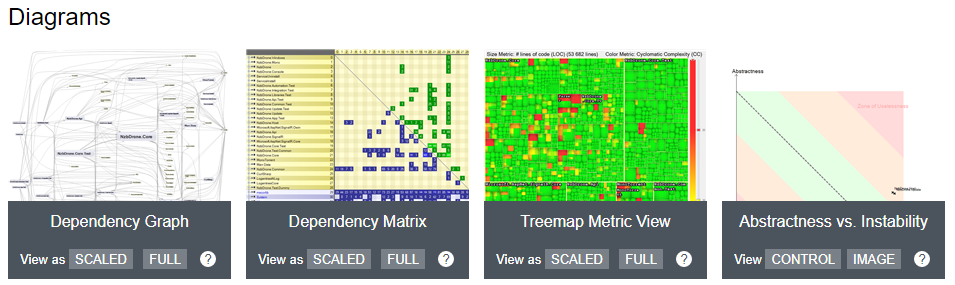
To show you how expressive these diagrams are, let’s take a look at the treemap:
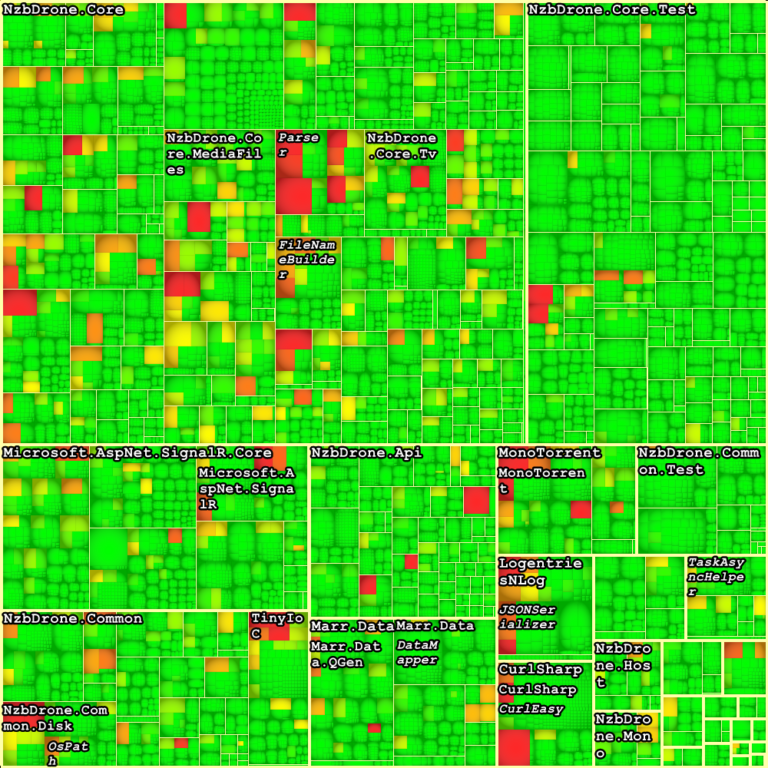
In this particular case, the tremap view demonstrates the most complex methods in the solution.
Each rectangle is a method, and the area of the rectangle is proportional to the number of lines of code of the corresponding method. The colour of the rectangle then represents the Cyclomatic Complexity, which measures the unique logical paths that can be taken through a code structure.
You’ll have to take my word on this, but the chart is fully navigational! You can zoom in each area and interact with it to identify the culprits! I think it’s fantastic the way NDepend has managed to find ways to visually represent this complex information. I can see them being extremely useful in larger projects, helping project leads further understand why the team unintentionally (or intentionally) avoids working in those areas!
Reports: “the cherry on the top”
Lastly, and as the figurative cherry on the top, NDepend provides an excellent way to view all of the information mentioned along with many more things in a single place. The reports can be exported to a fully navigational webpage:
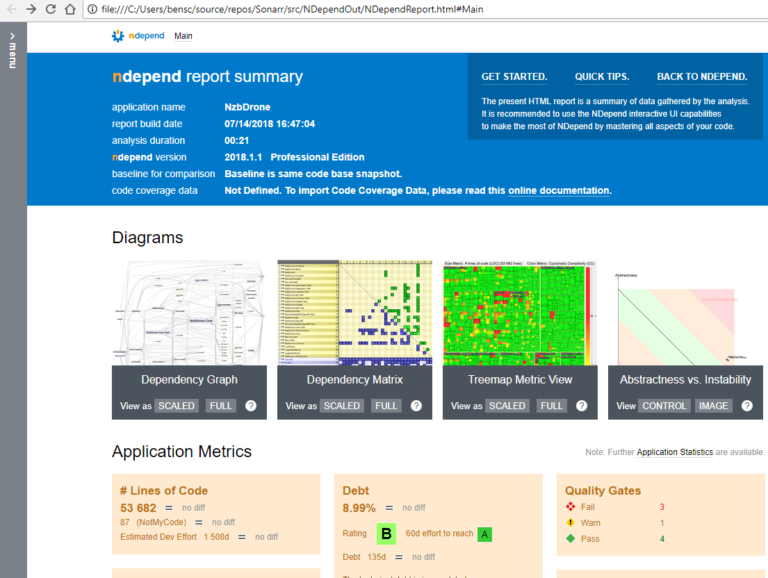
It’s effectively a full-blown website (over 18mb in size!). These reports are detailed, and they have as much breadth and depth as the VS tool! I could totally see a dev team producing one of these reports and discussing it during a meeting. I can also see it being used to compare two points in time to show how the project has evolved. The possibilities are truly endless!
In the future, I think it would be useful if there were the tools to produce a historical snapshot of the project’s health. It would then be possible to compare multiple snapshots, which would reveal how the code base has evolved over time and how the team are handling complexity and technical debt etc. This could provide some really interesting trends.
Conclusion: “like a seasoned architect”
This review is really only the tip of the iceberg; there are so many more features and metrics that NDepend can do for you. I expect it will be a few weeks before I have uncovered them all, and truly unlocked its full potential!
As a summary, I started off discussing a number of other tools that I had recently used as I thought NDepend would somewhat overlap, but instead, I learned that NDepend is solving a very different problem at a completely different scale. Resharper, intellicode and roslynator are focused on the raw syntax. When using those tools, it’s a bit like having an extremely opinionated programming buddy who is interested in how you write the code, on a line by line basis. Their ultimate purpose is to suggest better (and often more sugary) syntax and help you write cleaner code. In contrast, NDepend is like having a seasoned architect look at your whole design to ensure you’re following SOLID principles, along with crunching a bunch of metrics to reveal the health of your code base. It ensures you have a clean architecture. I learned that the tools are not exclusive, rather they are inclusive.
My overall experience with NDepend is extremely positive. The only minor gripe I encountered was that some of the descriptions could be simplified and improved, but this might be somewhat subjective. There are also a number of features I’d like to see added in future releases, particularly the introduction of an abstract concept for measuring time, but again, it’s not at all a deal breaker.
NDepend is almost achieving the impossible. The nature of the data is extremely complicated, but it strikes an elegant balance between simplicity and detail in all of the metrics, diagrams and UI pages. It also has an extensive number of options, allowing you to configure and even write your own metrics using CQLinq, which makes everything more expressive! Above all, the one thing that really stood out was the ease of navigation. I loved the experience of navigating from the very top, all the way down to a specific line of code.
So, there we have it! I’d like to thank once more Patrick Smacchia for making me aware of his excellent product, and for giving me the opportunity to review it. I am truly delighted to have discovered such a tool, which I’ve now added to my ultimate developer tool list!